

Splynx monitoring is based on SNMP, RRD, and Ping tools. The administrator can set up monitoring for any OID supported by hardware vendors and draw charts with Splynx. The statistics are linked to customers’ accounts gives them a possibility to check the used data through the Portal or mobile app.
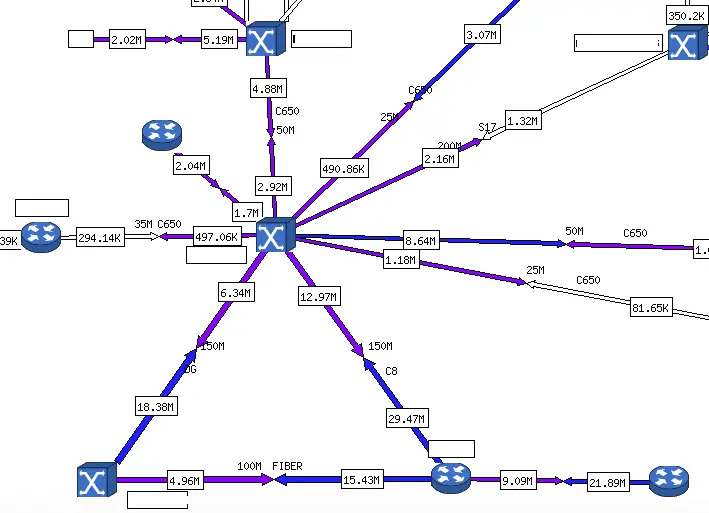
Our monitoring supports weather maps as it’s shown in the picture below. At the moment you can use open-source projects and connect them to Splynx. It’s a very powerful tool for visual interpretation of networks and it can be easily connected to the Splynx ISP Framework.

Network monitoring enables the sending of alerts via email and SMS gateways to be always aware of the status of your devices and take immediate actions.
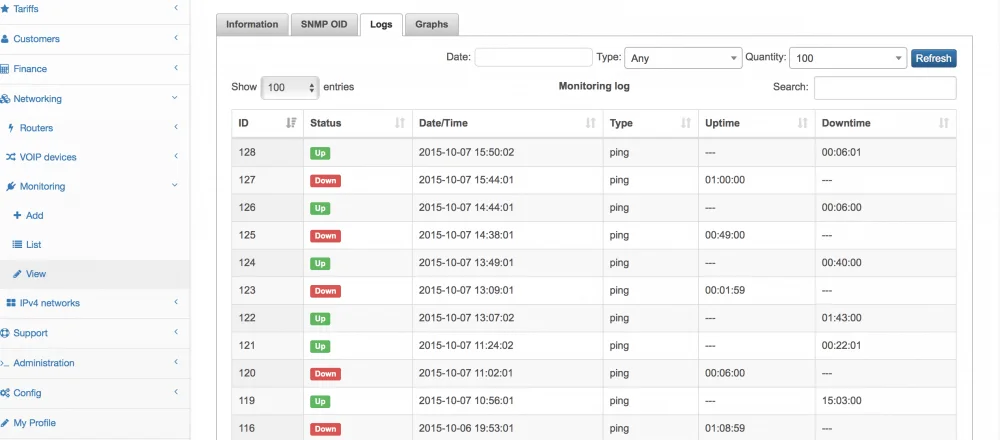
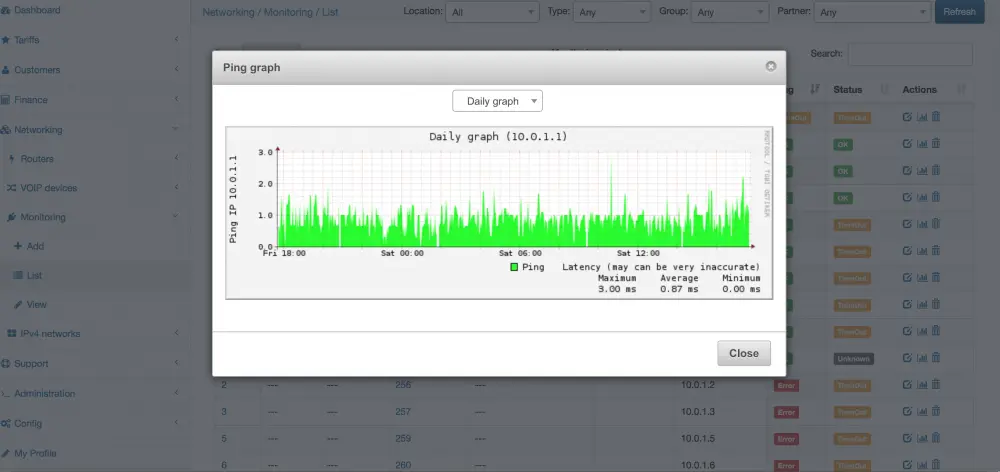
The following pictures show SNMP logs and RRD charts. We are using RRD as a technology for data logging and generating charts.


SNMP monitoring is described in a video tutorial.
Here’s how you can set up ping monitoring.
Example of Mikrotik CPU usage monitoring.
How to set up Mikrotik Memory usage monitoring.
Find out how Splynx helps ISPs grow
Learn more