
Share


When it comes to bringing usage data into Splynx, one of the methods that can be applied is NetFlow accounting. NetFlow accounting uses the NetFlow protocol that is universal for many manufacturers of network equipment. Using this protocol is convenient as the router (sensor) transfers packets with usage data information to the server for analysis at the right time.
Below is the topology sample that depicts the captured flow of how Splynx and NetFlow accounting work.

Splynx server is both a NetFlow collector and NetFlow analyser at the same time. When receiving NetFlow packets, these data are instantly analysed, and the exact amount of traffic used by a subscriber is determined. That traffic shows up in the customer’s statistics and in the Internet plan usage and Customer internet usage reports.
NetFlow packets are stored on the server. To prevent the unnecessary aggregation of already analysed packets, you can control how long NetFlow packet data is kept for each router in Splynx, setting it in Config → Networking → NetFlow accounting → Expire options.
Set the router’s accounting type. In Networking → Routers, open the router (or add it). Its IP/Host must be the address the router’s NetFlow packets come from. In the Radius & authentication block, choose NetFlow accounting in the Accounting field; authorization can stay on RADIUS. If the router runs RouterOS 7, don’t use API accounting: Splynx notes that it is only supported on RouterOS versions lower than 7.x.

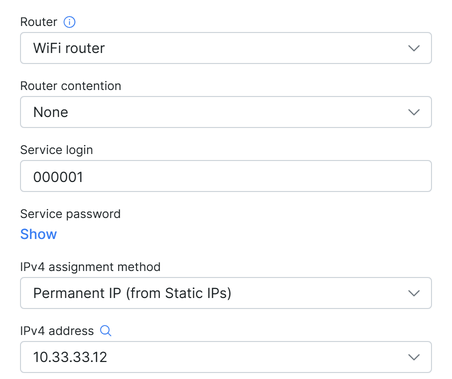
Link the customer’s service to the router. In Internet services, specify which router is used: open the customer, go to Services, edit the Internet service, choose the router in Router, and set the IPv4 assignment method and the address (or pool).
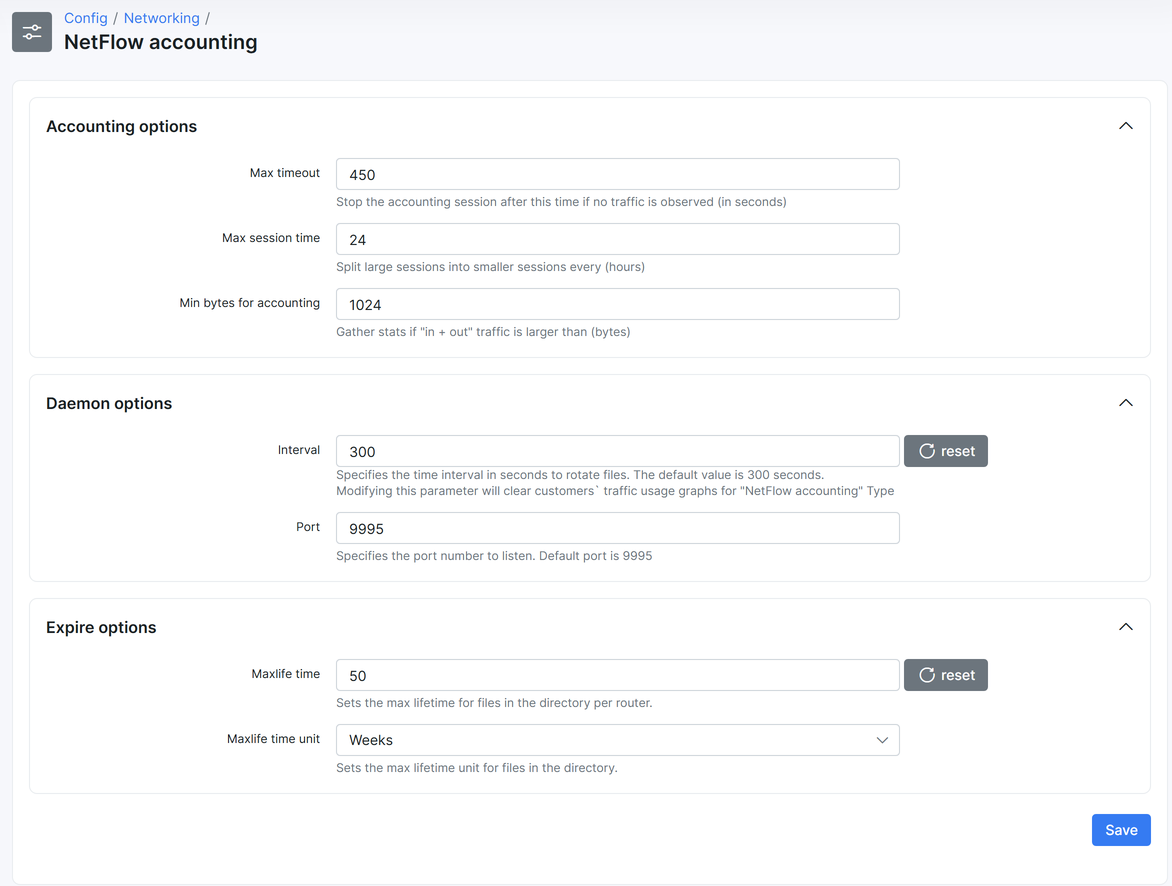
Check the collector settings. Specify the port on which the server will scan and collect NetFlow packets (udp/9995 by default) and the session timeout. Both are in Config → Networking → NetFlow accounting, together with the file rotation interval and the expire options:
Point the router at Splynx. On the router, export NetFlow to the Splynx IP on port 9995, with the router’s IP as the source address, and turn off RADIUS accounting for the services NetFlow counts. For MikroTik, the RouterOS 7 commands and WinBox steps are in our guide to MikroTik NetFlow on RouterOS 7. Splynx also supports NetFlow v9; the setup example in the Splynx documentation uses v5.
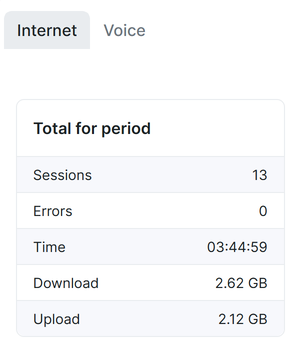
Check the traffic. After configuration, the server will start a process that will collect traffic data on the specified port, divide and analyze it for each router. Traffic shows up 5 to 10 minutes after the router sends its first finished flow: open the customer’s Statistics → Internet.
NetFlow accounting only works if the source IP of the NetFlow packets matches the router’s IP/Host in Splynx. If the router’s outgoing traffic is translated (NAT) to another address, connect the router to Splynx over the built-in WireGuard or OpenVPN server (Config → Tools → VPN).
In addition, you can configure subnets for tariffs that include services where data usage accounting is ignored.
To set up the subnets, go to Config → Networking → Traffic class. In the tariff settings (Tariff plans → Internet, edit the plan), choose them in Exclude traffic classes from accounting.
Splynx uses some scripts from the nfdump package to calculate traffic:
daemon nfcapd scans the port, and the data can be received there. When the interval for data collection ends, the data will be recorded in a file../var/www/splynx/system/scripts/accounting-netflow starts and runs the nfdump process with the specific parameters. The script gets a response and converts it into the acceptable format for the Splynx Accounting Processor.To check if the nfcapd daemon runs, use this command:
ps -aux | grep nfcapd
To check the log:
sudo tail -f /var/log/syslog | grep nfcapd
nfcapd saves the collected traffic to /tmp/nfcapd/, with a subfolder per router named router_ plus the router’s ID in Splynx. To list everything collected from router 1 for the service with IP 192.168.1.25:
nfdump 'host 192.168.1.25' -R /tmp/nfcapd/router_1/ -A proto,srcip,dstip,srcport,dstport -O bytes
Add -t to limit the output to a time period, for example from 2023/01/25 to 2023/01/26:
nfdump 'host 192.168.1.25' -t 2023/01/25.00:00:00-2023/01/26.00:00:00 -R /tmp/nfcapd/router_1/ -A proto,srcip,dstip,srcport,dstport -O bytes
In the customer’s internet session statistics, you can notice that the last two sessions are listed without MAC and Session ID values. This is a common condition due to the limitations in NetFlow v5, which results in such data not being transferred to Splynx.

MDU Wi-Fi onboarding: let residents sign up, pay, and connect on their own
Give every apartment a QR card and let residents sign up, pay, and get a private Wi-Fi password on a shared SSID, withou...

What is mPSK? Multiple PSK for simple per-device control of Wi-Fi networks
mPSK support is part of Splynx, so you can easily segment your WiFi Network with Private Pre-Shared-Keys without requiri...
Improve Non-Payment Handling with Splynx DNS Blocking
Tackle non-payments more proficiently by redirecting blocked customers to a landing page. From there, they can easily ac...
Switch to the safe side and let network engineers sleep well at night
Running a local ISP comes with enough challenges — worrying about network failures and blocking non-paying customers d...

Using TR-069 ACS to Deliver High-Quality Wi-Fi to Residential Customers While Cutting Costs
TR-069 ACS isn't a magic pill for all troubles, but it can make your life much easier. This article we'll guide you thro...

Bufferbloat explained: why bandwidth isn’t the key to QoE for ISPs
Bufferbloat is lag that appears when a link is busy: oversized buffers fill up and every packet waits. More bandwidth wo...

Simplifying Network Management for ISPs with Splynx Network Sites
Splynx Network sites bring ISPs around the world more streamlined client communication and efficient tracking for all yo...
Simplifying network troubleshooting with Ping and Traceroute features
Explore Splynx 4.2's Ping and Traceroute features, simplifying network troubleshooting and boosting ISP team efficiency.
Hardware Backup & Change Management in Splynx
Maintaining network stability and reliability is paramount for both ISPs and their valued customers. To address this, Sp...
Bandwidth management in Splynx
As a local ISP business owner, ensuring efficient bandwidth management is crucial for maintaining customer satisfaction ...
Find out how Splynx helps ISPs grow
Learn more


